Animating and labeling figures with ImageMagick
ImageMagick is an incredible command-line tool that lets you edit and convert images of all sorts. Suppose you wanted to compare some figures that you’ve generated, and label the figures with their respective filenames so that you know which is which. Here’s a quick worked example in R and Terminal that gets you going.
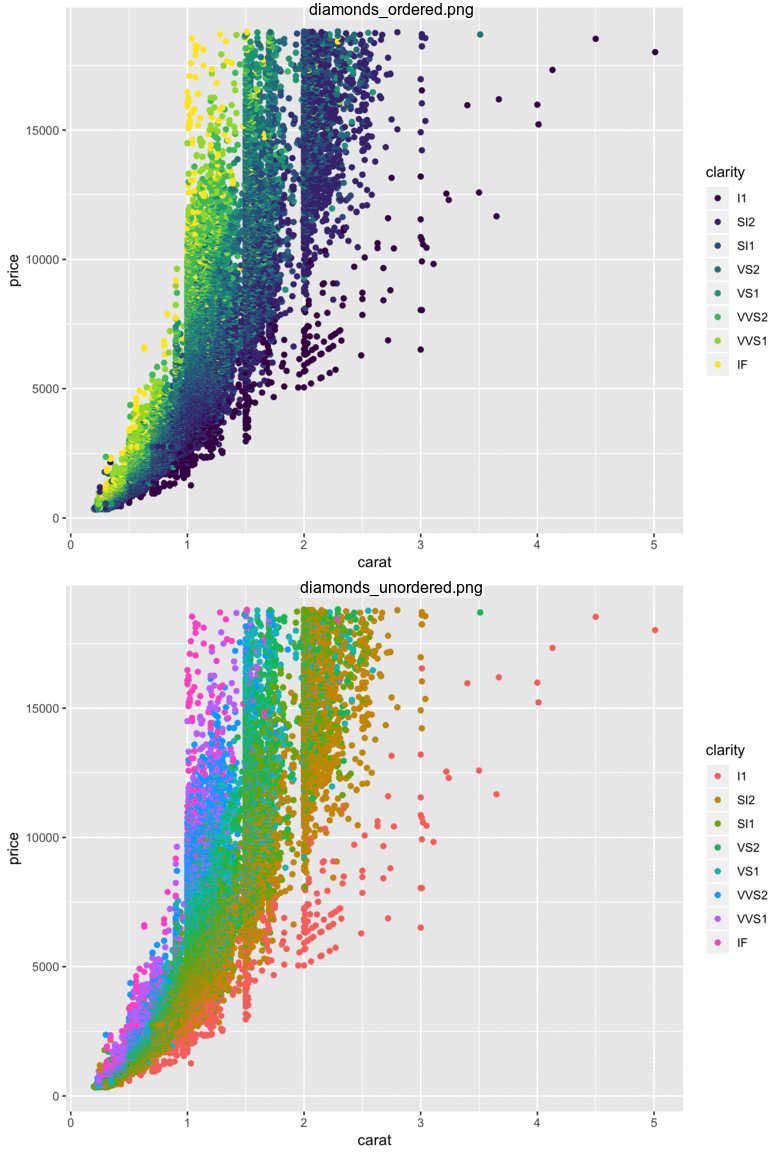
First, let’s generate some figures to compare. The latest version of ggplot2 (3.0) recently added the new viridis color palettes as an option, and by default, that are ordered factors use the viridis palettes when assigned to the color or fill aesthetic. Let’s plot the default diamonds dataset to compare the two:
library(ggplot2)
# Uses viridis by default
ggplot(diamonds, aes(carat, price, color = clarity)) + geom_point()
ggsave("diamonds_ordered.png")

# Unorder the factor to use the unordered palette
ggplot(diamonds, aes(carat, price, color = factor(clarity, ordered = FALSE))) + geom_point() + labs(color = "clarity")
ggsave("diamonds_unordered.png")
Next, let’s fire up ImageMagick to convert this to an animated GIF. Sadly we can’t use this in papers yet but it can easily be blogged or tweeted about. brew install imagemagick if you don’t have it already, then:
convert -resize 33% -gravity north -undercolor '#ffffff80' -pointsize 16 -annotate 0 "%f" diamonds_*.png -set delay 100 -loop 0 diamonds_flicker.gif
This does a few things:
- resizes the image to 1/3 the original size
- adds the filename to the top of the image, with a slightly transparent white background
- sets a delay of 100 milliseconds between frames
Here’s the end result:

There’s a lot of cool stuff that ImageMagick can do (basically every kind of image manipulation imaginable), so check out the manual and start hacking!