Download shapefiles from ESRI ArcGIS Online Story Maps
Recently, we needed to get out some shapefiles from an ArcGIS Online map. It’s immediately clear that there’s a lot of data, and no obvious way to get it from a download or share link anywhere on the app page. The desired solution is anything but taking a screenshot and tracing it in ImageJ, as that’s an absolute last resort. In this post, I’ll walk through how I managed to get those shapefiles downloaded, and hopefully provide some easy tips to do the same for other ArcGIS online maps.
The power of the web inspector
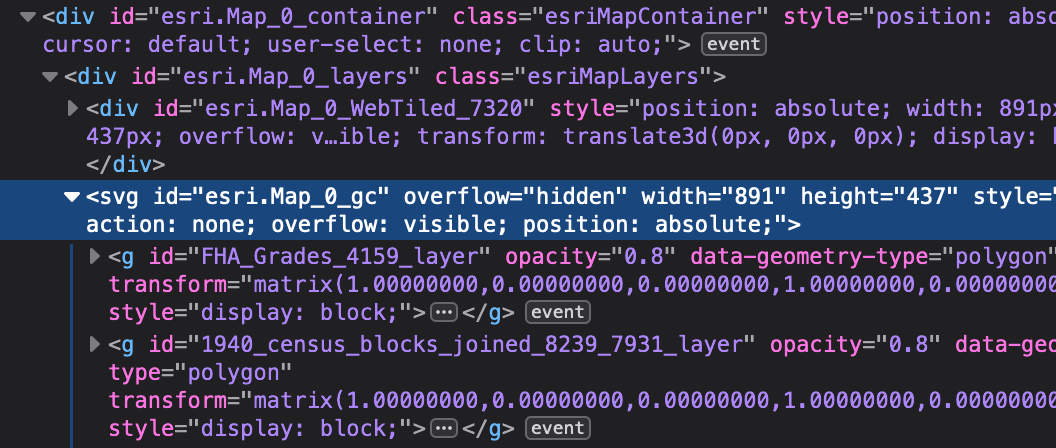
This is fundamentally a web scraping task, and I’ll start with opening the web developer tools in Firefox, by right-clicking a promising bit on the page (the map itself) and selecting “Inspect”. Looking through the HTML tree in the web inspector panel that pops up, I can see that while the shapefiles do appear to exist locally, these are parsed into a gnarly embedded SVG object. This could be used to reconstruct the shapefile, but it seems like a big pain that I don’t want to deal with, so I move on from this avenue.
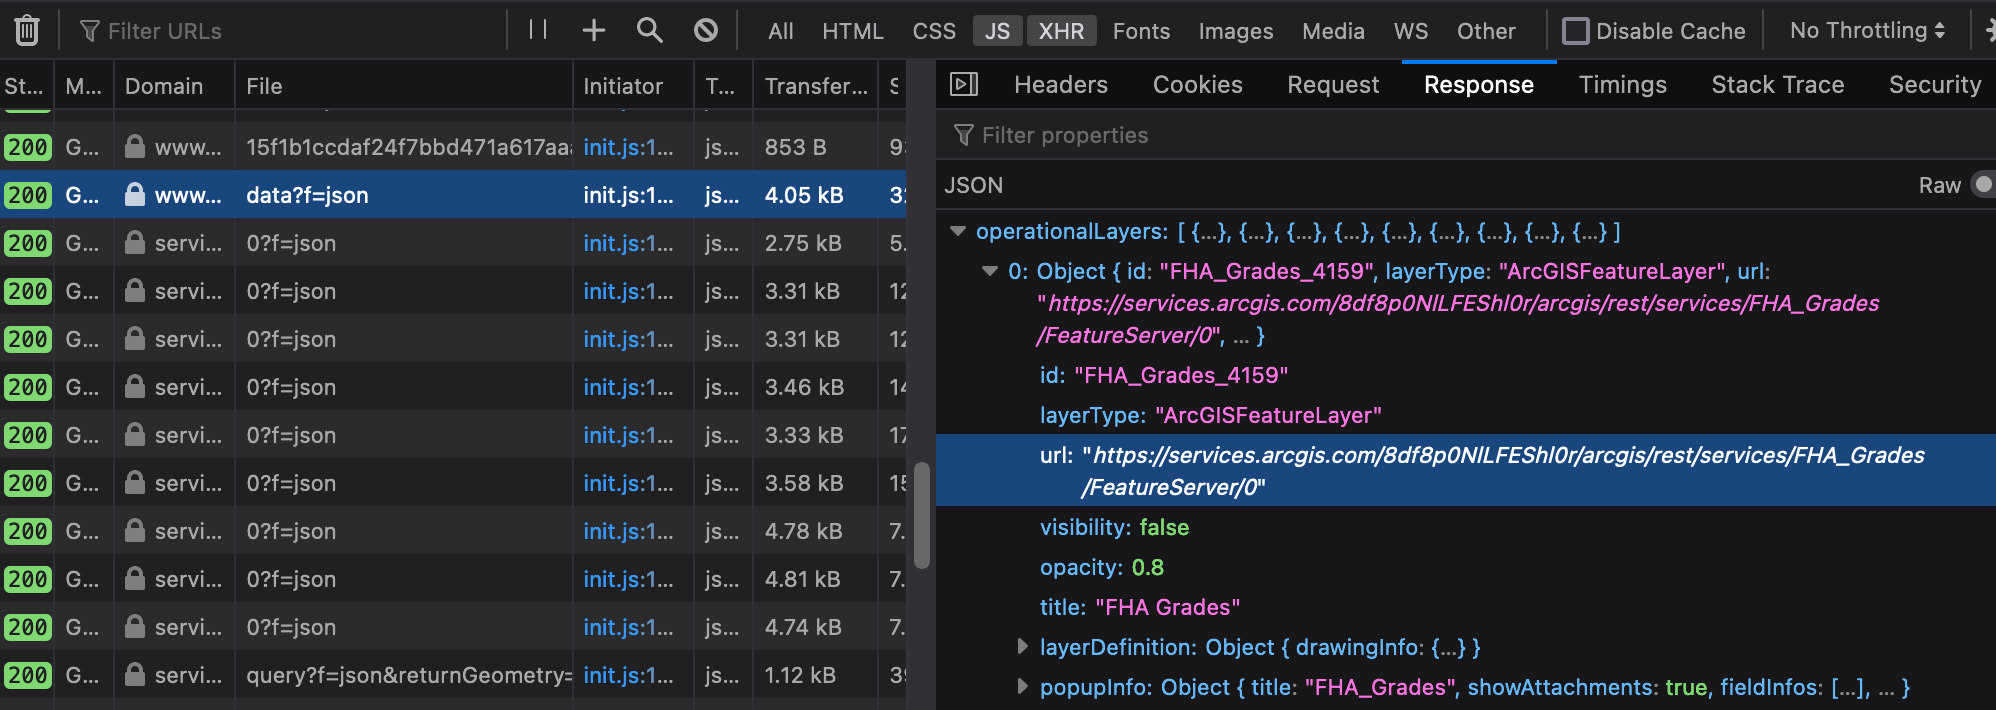
Next, I’ll check out the network tab. I’ll need to refresh the page, and I can see that there are a ton of requests that go to a lot of different places. But, I suspect that any shapefile that’s loaded will likely be downloaded via XHR, initiated from Javascript, and quite possibly hitting some API endpoint that probably speaks in JSON. I filter by JS and XHR and immediately see an request that pops out at me, to an endpoint at services.arcgis.com called data with a query payload of f=json. Inspecting that response object leads me to another API endpoint that appears to be what I want!
ESRI API endpoints
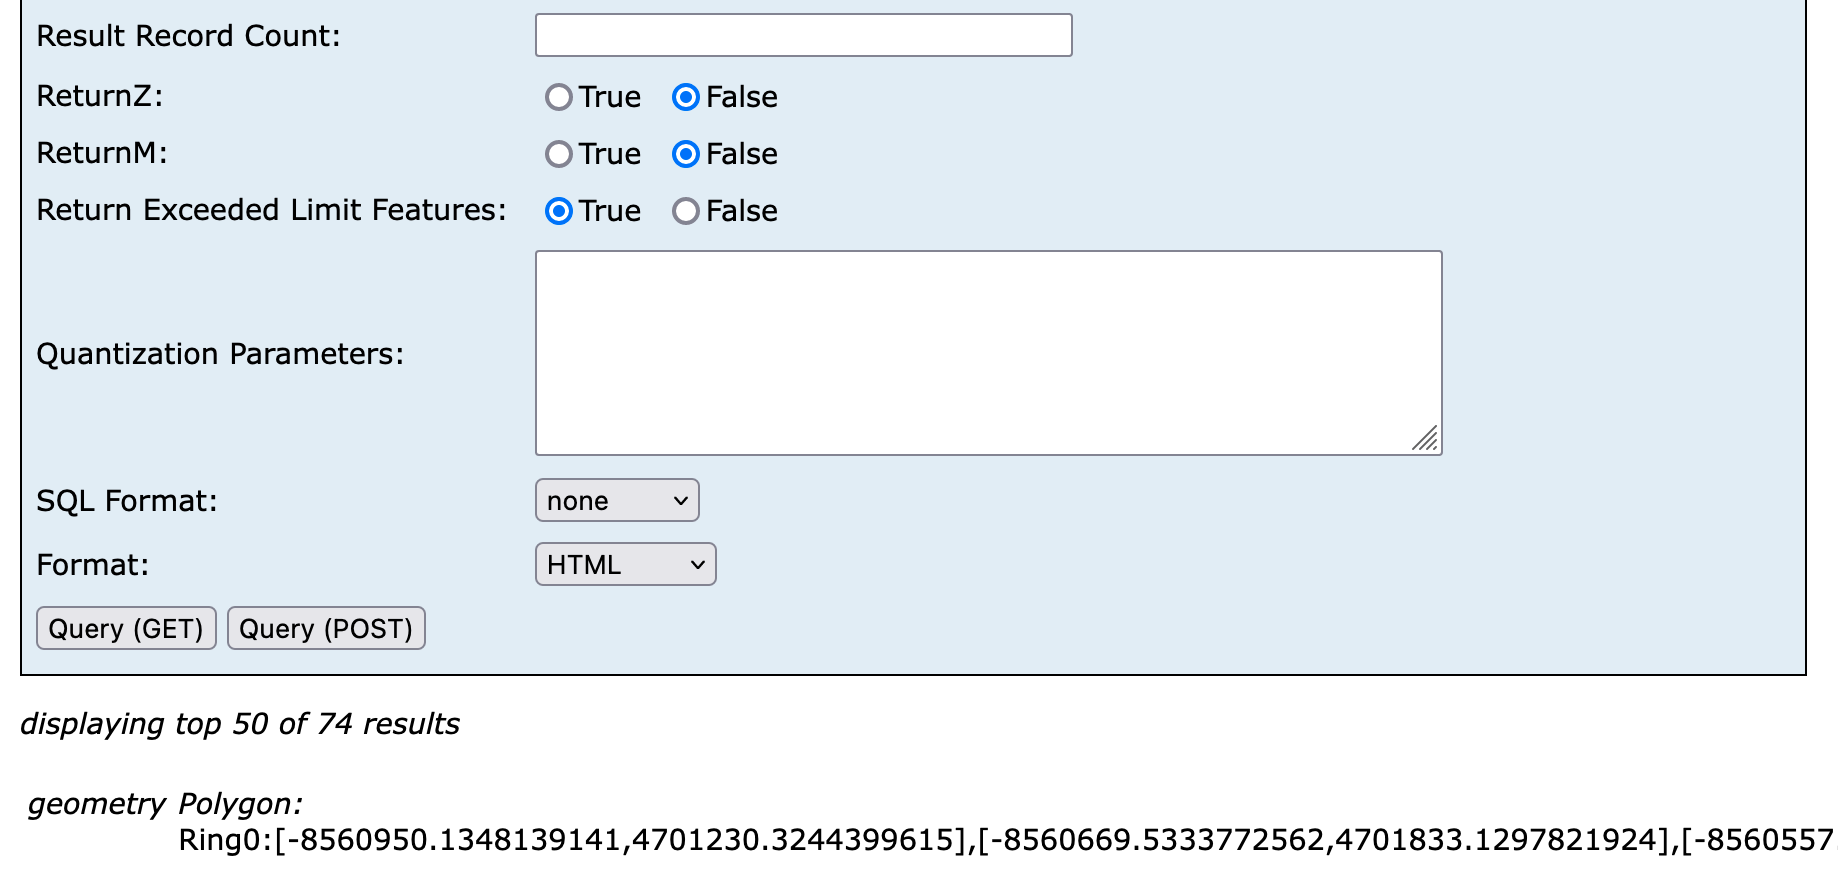
I’m actually fairly familiar with ESRI’s REST APIs, and I know that I can actually navigate to the API endpoint and it’ll provide a fairly good description of its data. I can also interactively query it in the browser, without having to muck about with cURL in Terminal or anything like that. ESRI is quite humane in this respect, but again, there doesn’t seem to be an easy way to download the full shapefile directly from this endpoint, and I don’t feel quite up to the task of writing out a shapefile by copying and pasting a bunch of stuff.
A quick Google sojourn leads me to pyesridump, a wonderful tool by the folks over at OpenAddresses. This is actually exactly what I needed! Install the esri2geojson command with pipx:
% pipx install esridump
  installed package esridump 1.11.0, installed using Python 3.10.8
  These apps are now globally available
    - esri2geojson
done! ✨ 🌟 ✨

% esri2geojson "https://services.arcgis.com/8df8p0NlLFEShl0r/ArcGIS/rest/services/FHA_Grades/FeatureServer/0" fha.geojson
2022-11-03 23:42:54,990 - cli.esridump - INFO - Built 1 requests using resultOffset method
Now to fire up R and see that everything looks right by plotting it.

It looks fantastic, and is ready for further data analysis now!
A more direct route
After all of this, I was curious if there was a better way, so I did some digging. This ArcGIS Online tool is called ESRI Story Map Series, and the source code is actually available on GitHub. Looking through the repository we can see it’s a Javascript app with a fairly rich library API, intended for ESRI’s customers to develop “story maps” with deep integrations to justify their hefty enterprise contracts. In the README, one of the code suggestions points in an interesting direction, and I reopened the web inspector console to check it out.
Based on the README example, I learned that the top-level object is called app, and that layers can be obtained through a method on the app.map object. I grub around in the app’s internal data structures using the Javascript console, and discover an interesting _layers key inside this object, which seems to have the relevant data that I’m interested in.
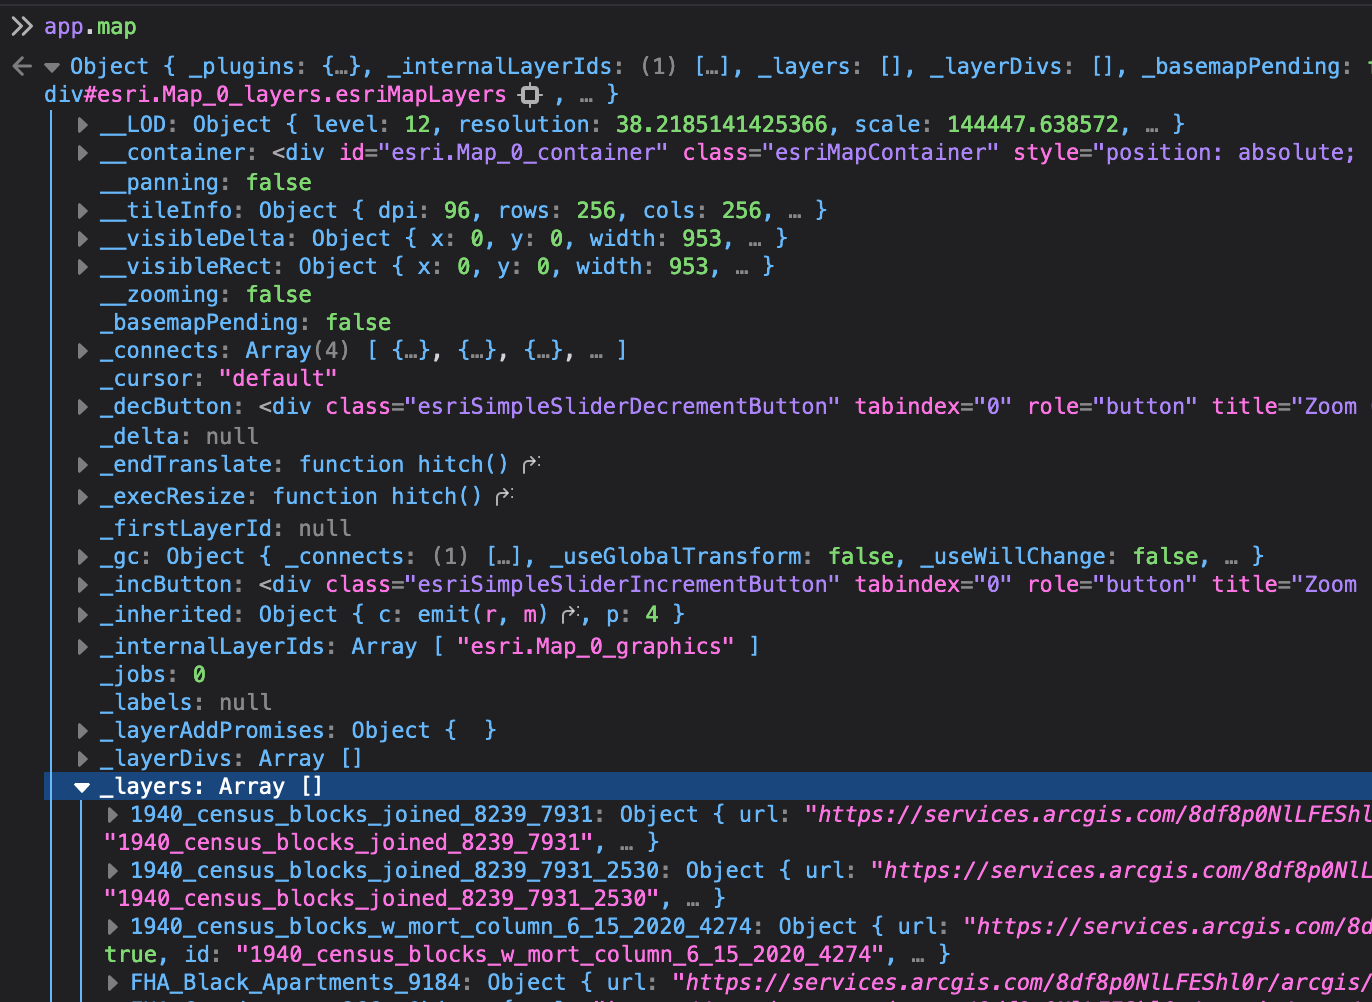
The full invocation in the Javascript console to get the ESRI REST API endpoint is therefore:
app.map._layers.FHA_Grades_4159.url
// "https://services.arcgis.com/8df8p0NlLFEShl0r/arcgis/rest/services/FHA_Grades/FeatureServer/0"