Innovation, growth, and stability in biology and other systems
- Motivating Example
- Gambler’s Ruin
- The Red Queen
- Now You’re Thinking With Rates
- Rates in Cultural Evolution
- Motivating Conclusion

This is an edited text version of what I spoke about on May 23, 2017 at the Gruter Institute Conference to a general audience. I talk about some recent developments in macroevolutionary methods, how we’ve applied them to problems in biology and cultural evolution, and hopefully an inspiration for more people to start thinking about their own systems in this way.
Motivating Example

Thanks for inviting me to speak at this conference. Like most of you, I flew through Reno to get here, and I’m always surprised at how common the slot machines are. Now, I personally don’t play slots. since my favorite is actually roulette.
I like roulette for a couple reasons. As a grad student, it’s quite cheap compared to the other table games like blackjack, it’s less antisocial than slot machines, and most importantly, you’re more visible when the server comes around to comp you a free drink.
But here’s what I don’t like about roulette, and this applies to any sort of gambling, is the house edge. You see, you’re always at a disadvantage. So even if you only bet on red or only bet on odd numbers, if the ball lands on zero or double zero, you lose. The chances are not 50-50. So in the long run, the odds are stacked against you and the expectation is that you lose all your money.
This graph is my cash over time at the roulette table. So let’s say I start with a small stake, and I bet conservatively on the odd numbers and win a bit of money. And as my cash hoard increases I can place more bets at the same time. And eventually I hit on a single bet (35 to 1 odds!) and start really rolling in cash. But then I unwisely keep playing and run out of money.
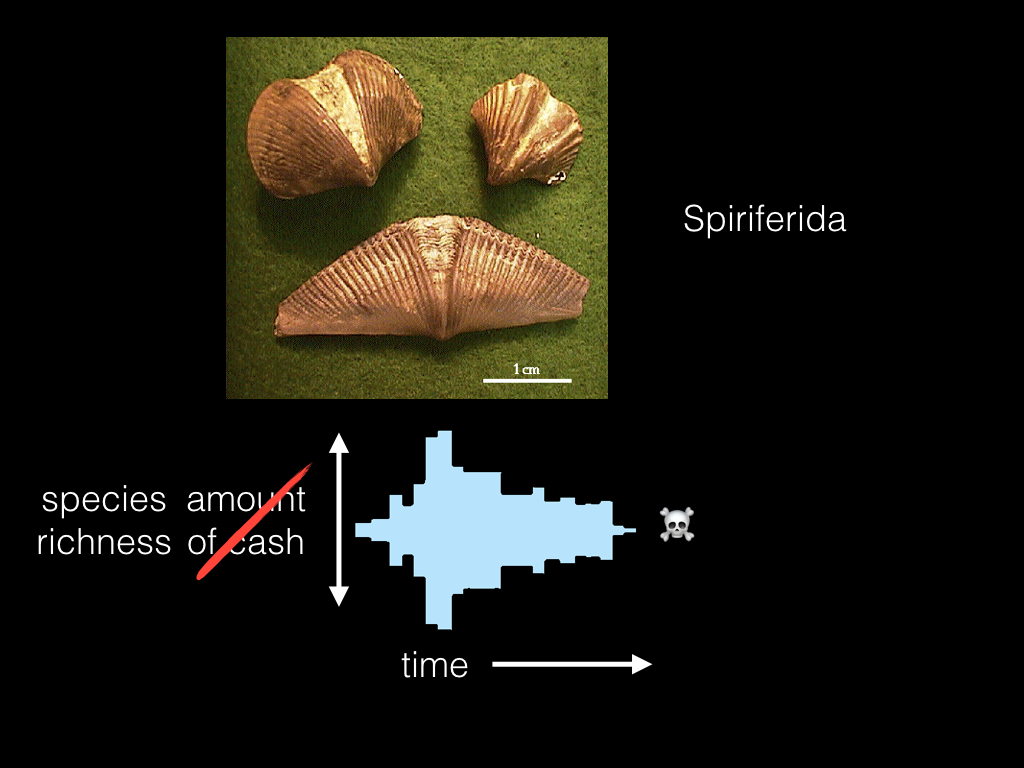
I’m actually an evolutionary biologist, not a professional gambler, so instead of roulette I’m actually talking about an extinct group of brachiopods, the Spiriferida. And instead of the amount of cash I have, I’m talking about the species richness of this clade. But like my game of roulette, these guys eventually lose and go extinct sometime in the Jurassic.
In fact, like most gamblers, over 99% of all lineages that ever existed have “lost” by going extinct! Is it possible that, like gambling, species go extinct merely due to bad luck? Or is there some other process happening?
Gambler’s Ruin
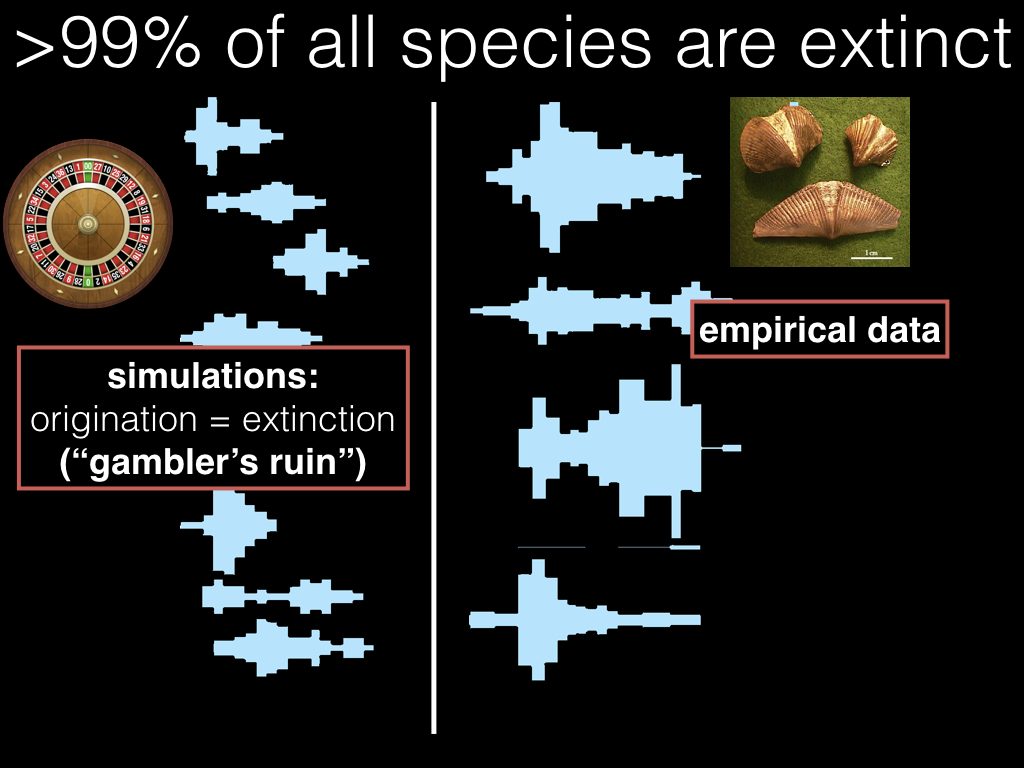
I’m going to show you two sets of taxa. One set is simulated, where the probability of a new species originating or a species going extinct is the same. And the other set is the actual species richness through time of a couple of different extinct clades.
The figures on the right are the empirical data. You might recognize our friends the Spiriferida at the top there. And on the left are the simulated data, where the rate of species origination is equal to the rate of extinction. Let’s call this “gambler’s ruin” because you’ll eventually run out of luck and go extinct.
What explains the shape of these diversity curves? Clades ultimately go extinct, but vary tremendously in their richness over their lifetimes. We can see that just by comparing among the right-hand clades: some are more boom-and-bust and others linger at roughly the same diversity for a long time before finally kicking the bucket. Why do some clades persist for a long time? What does it mean to see richness explode and persist? Wax and wane?
One point is that we might think there is a big difference in the forces controlling diversity for a short-lived clade that never reaches high richness and a long-lived clade that has a substantial richness peak. But, as the left hand plots show us, stochasticity can sometimes produce clades that look very different, even when the underlying process is the same!
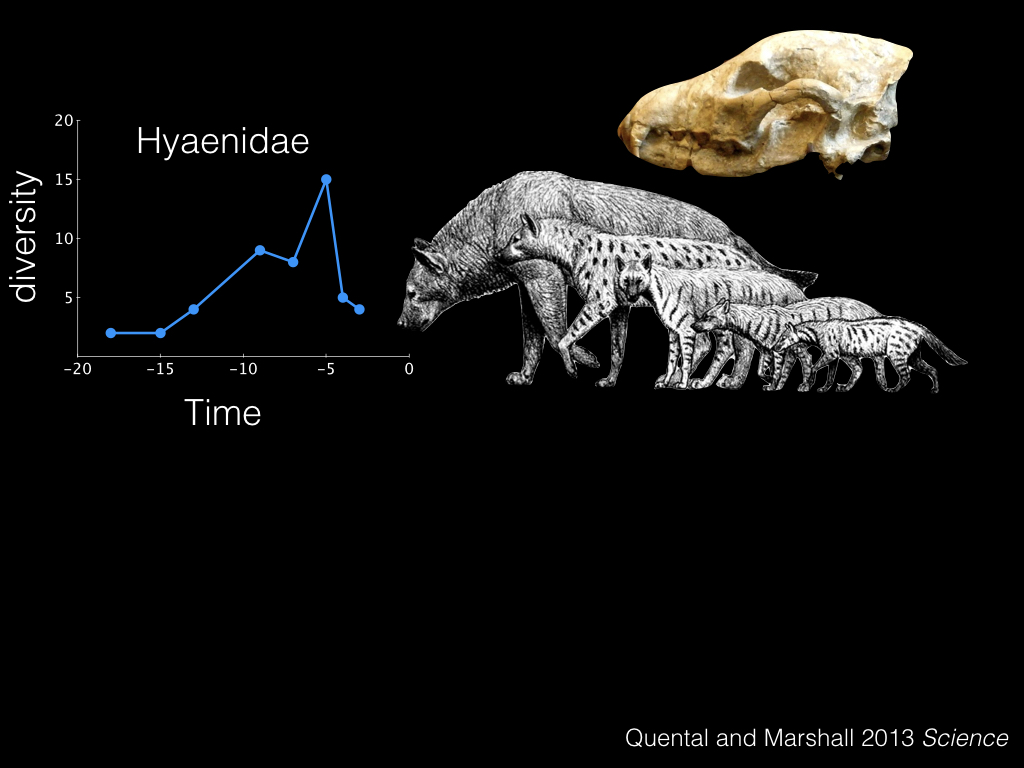
Instead of continuing to speculate, let’s actually test these hypotheses quantitatively. This is work from a great paper in Science a few years ago, by Tiago Quental and Charles Marshall.
I want to introduce you to a group of carnivoran mammals, the hyenas. These guys first showed up about 20 milion years ago, and as you can see they have similar rises and falls in their diversity over time.
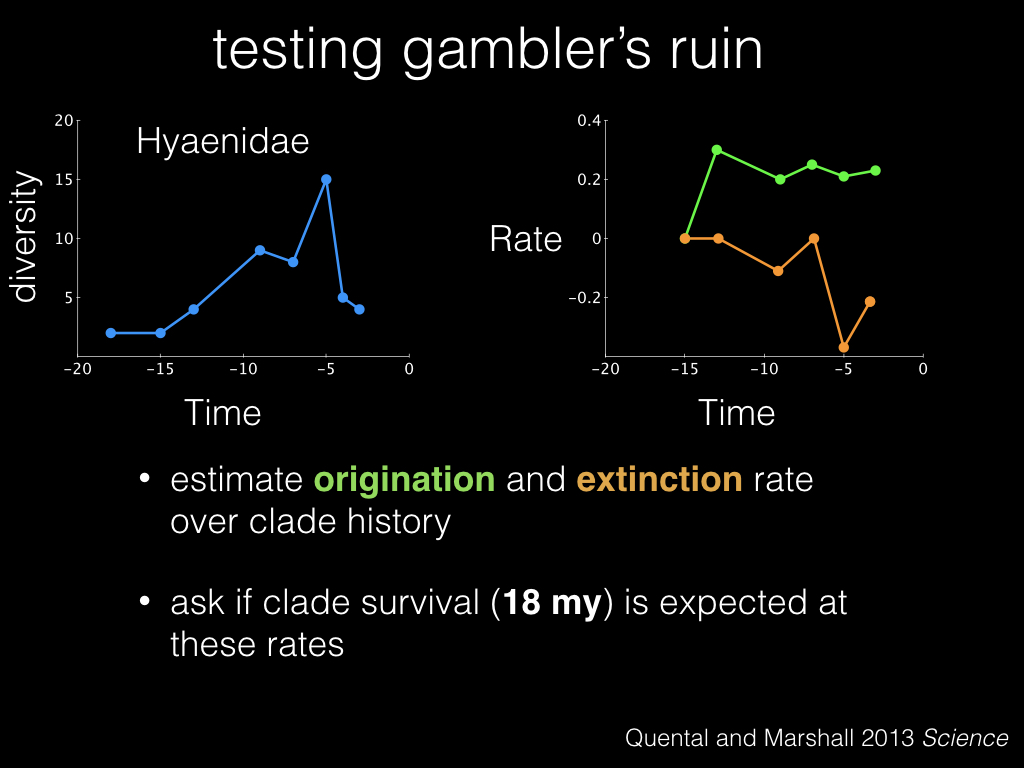
Suppose then that we believe that gambler’s ruin explains the dynamics of the hyena lineage. We can estimate their overall origination and extinction rate over the history of the clade, and ask if we expect the clade to last as long as its lifespan, 18 million years, given these estimated rates.

Based on those rates, we simulate the history of this lineage a bunch of times, and come up with a distribution of simulated clade lifespans. And here in red is our empirical lifespan, which is a bit shorter than what we typically simulated.
And in fact, we see this pattern repeating across all the groups that they tested. Clades tend to not live as long as we expect. What’s going on here?
The Red Queen
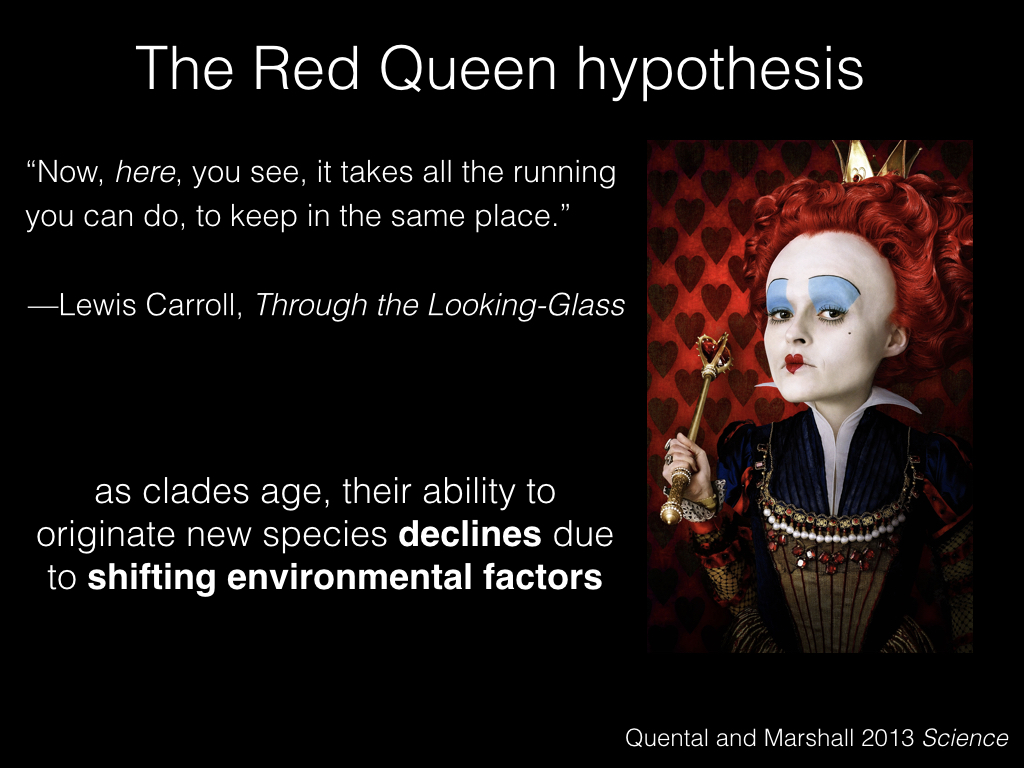
One thing that might be happening is the Red Queen hypothesis. This comes from Alice in Wonderland, where Alice is trying to get somewhere, but the ground is moving under her, so, as the Red Queen says, it takes all the running you can do to keep in the same place.
Biologists have invoked this hypothesis to explain a number of different things, usually involving sexual selection, but the way I’m going to use it here is when clades fail to thrive - their ability to originate new species goes down due to a change in their environment.
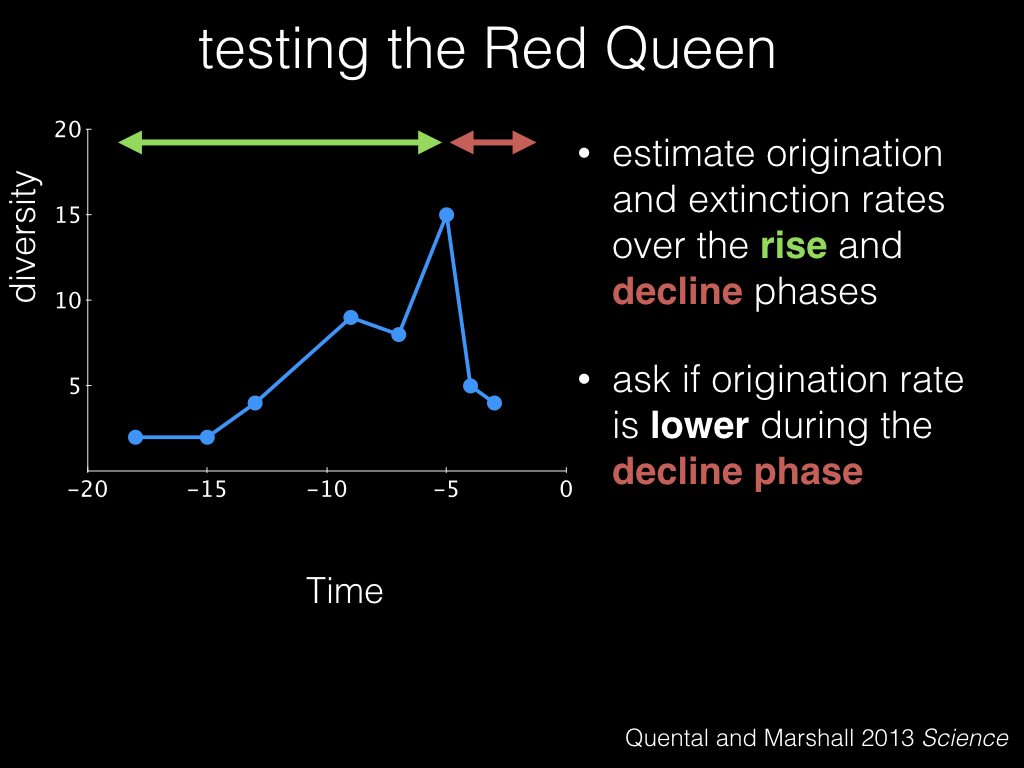
So to test the Red Queen hypothesis we estimate origination and extinction rates like before, but this time we split the clade history into a “rise” phase, in green, and a “decline” phase, in red. And we test whether the origination rate is lower during the decline phase.
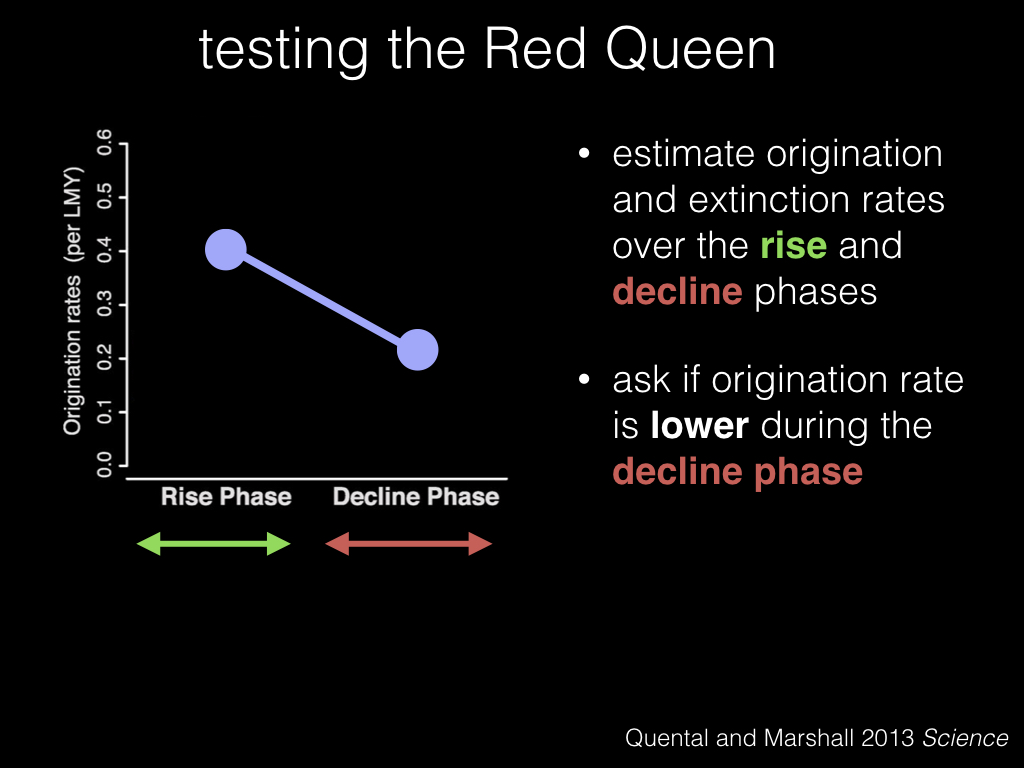
Under the Red Queen, we would expect that origination rates would decrease in the decline phase compared to the rise phase, and in fact that’s what we see happening in the hyenas.
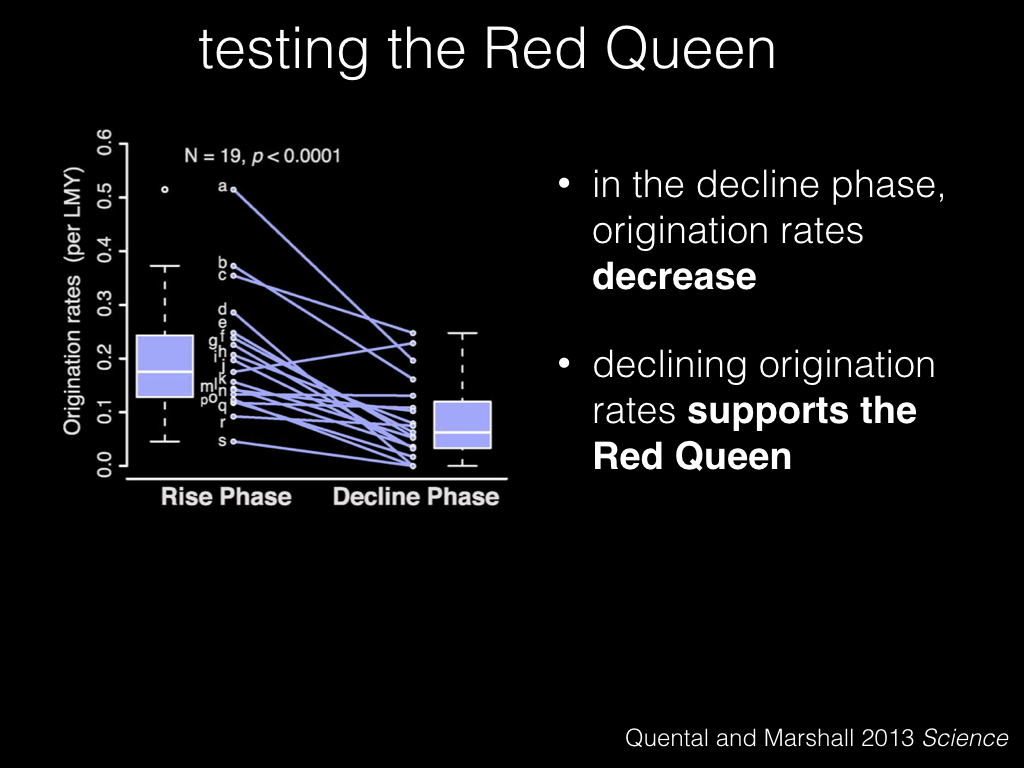
And this pattern holds true over most of the 19 lineages that were tested.
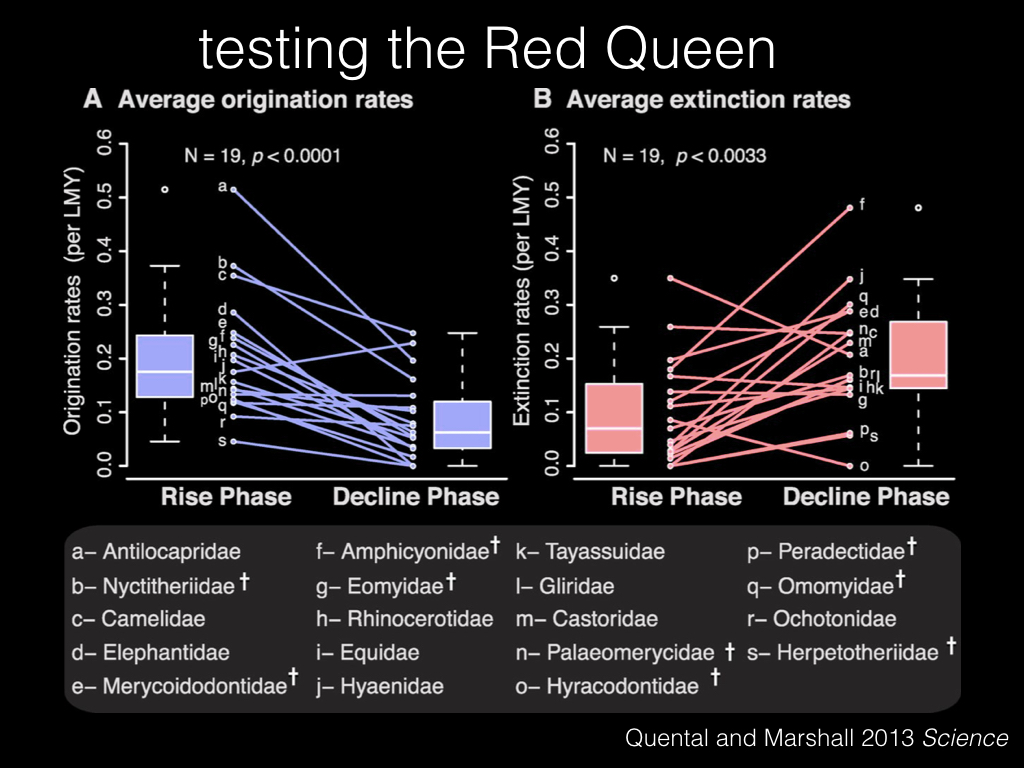
In fact, not only do we see a decline in origination rates, we also see an increase in extinction rates. So these taxa are getting hit twice as hard, by both low origination and high extinction.
Now You’re Thinking With Rates
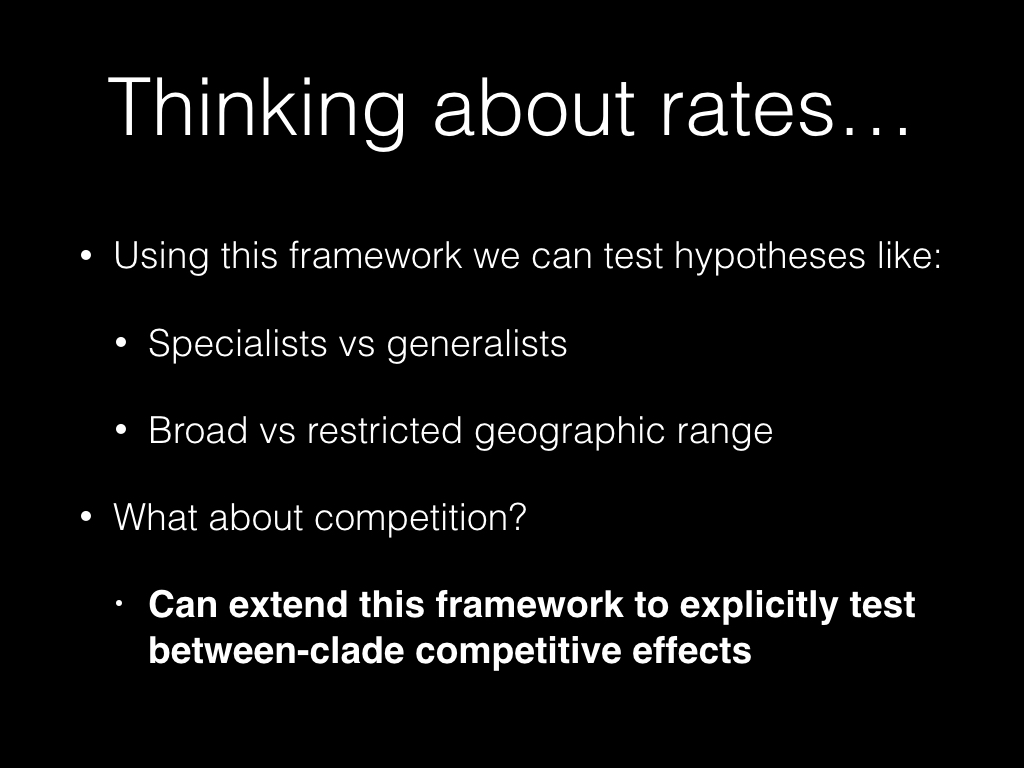
What I want to emphasize here, is the focus on thinking about rates. When we think about our data in terms of rates, we can use this framework to test a variety of different hypotheses.
Biologists have used this to ask things like, whether generalists outperform specialists. For example, in the carnivorans, it’s been shown that specialization towards hypercarnivory is also associated with increased extinction rates. And we can also see whether a broad geographic range tends to immunize lineages against extinction.
What’s nice about this framework is that it’s sufficiently general that we can extend it to test other hypotheses, such as the effect of competition on diversification.
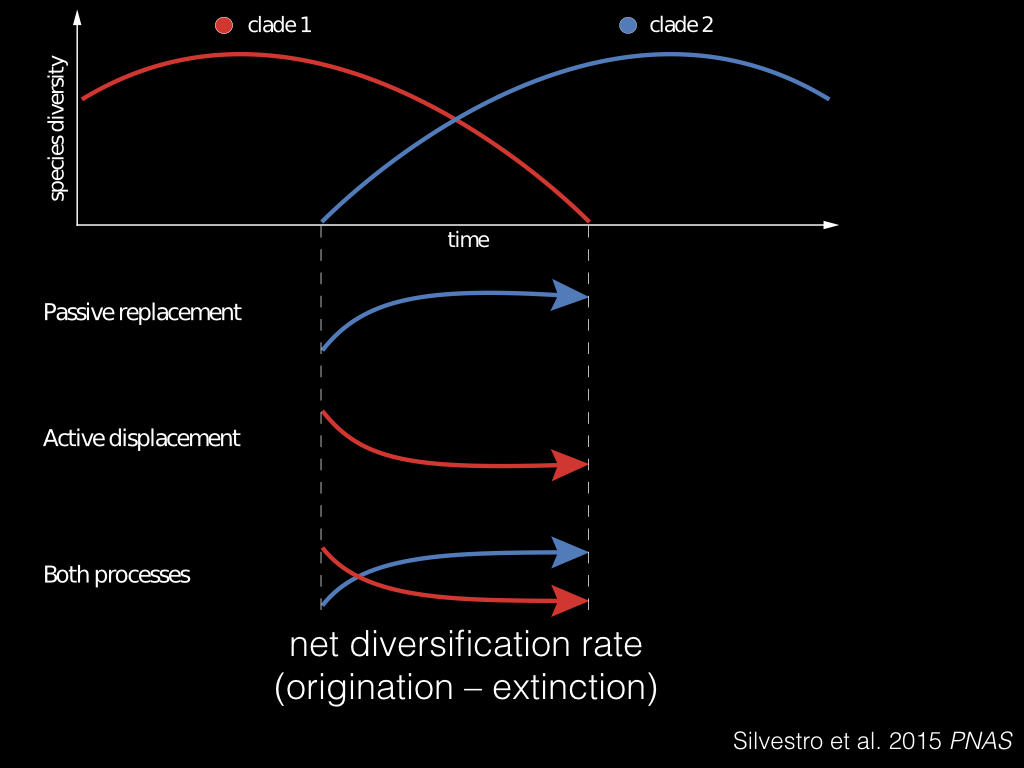
So here’s how we might test the effect of competition. Suppose we have two lineages, clade 1 in red and clade 2 in blue. And say they’re co-occuring, so we want to know what is the effect of the blue clade on the red clade? To do this, we calculate the net diversification rate, which is the origination rate minus the extinction rate, and look at the time period where these two lineages overlap.
There’s three things that could be happening here: the blue clade might just be on the rise, called “passive replacement”, the red clade might be getting pushed out, called “active displacement”, or both processes could be happening at once.
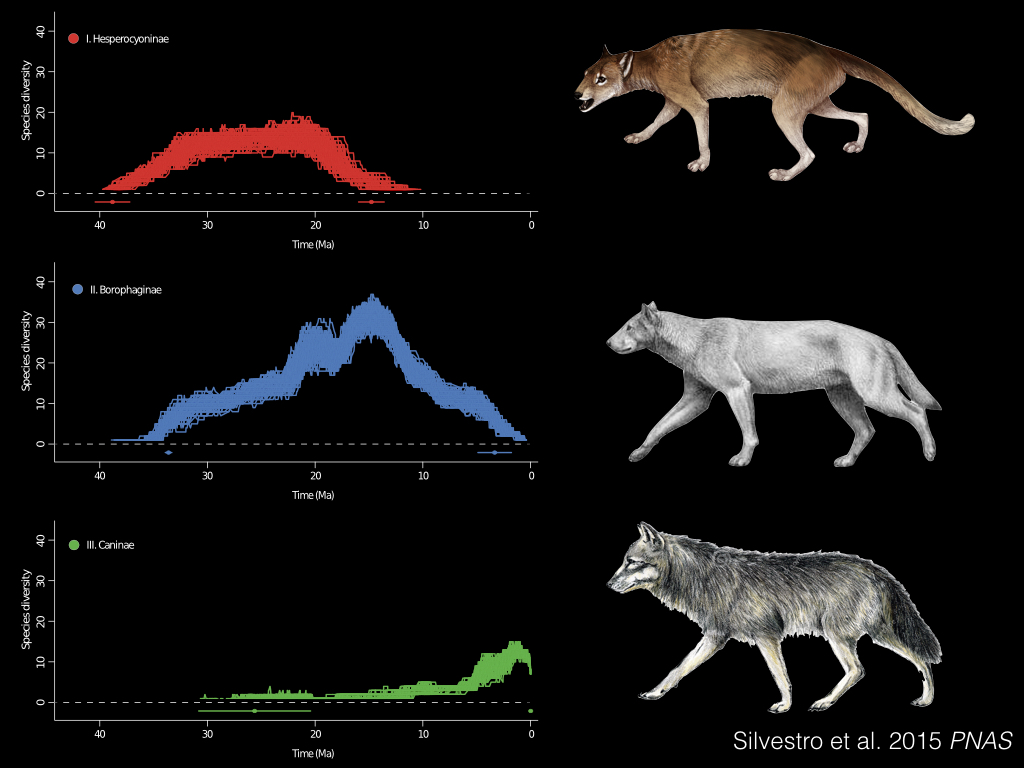
Here’s an example, again in the carnivorans. This time we’re examining three subfamilies of dogs; the Hesperocyoninae, in red; the Borophaginae, in blue; and the Caninae, in green. These guys are still around, and include foxes and wolves and the domestic dog.
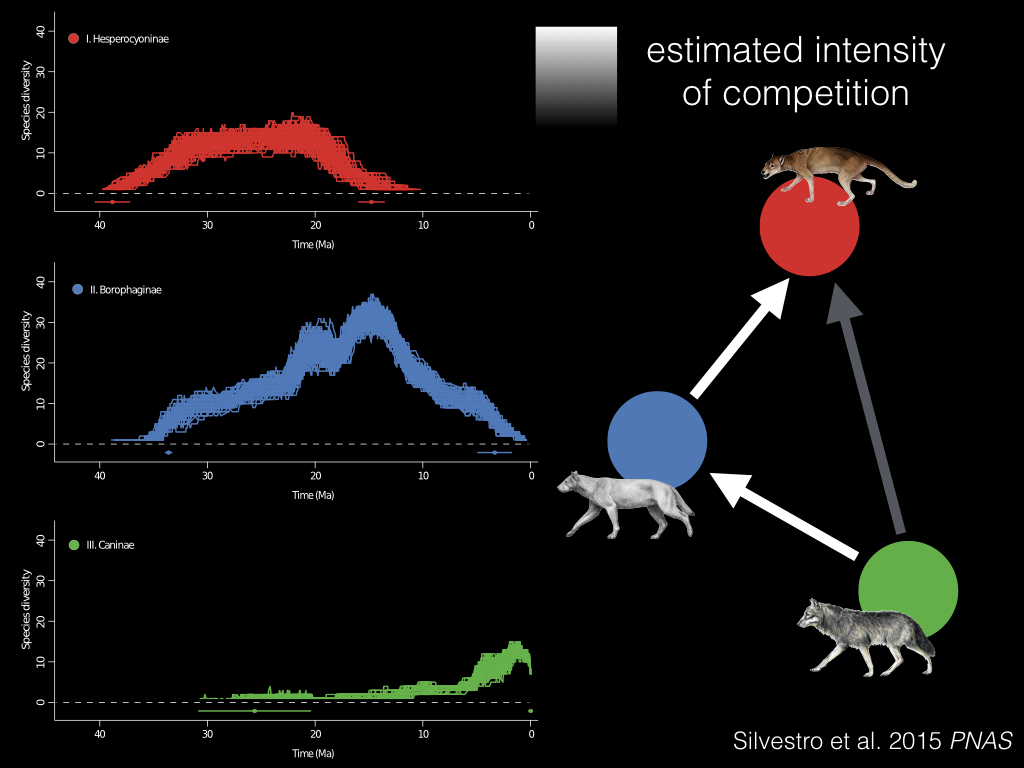
And what Daniele Silvestro and his coauthors found in their PNAS paper, was this pattern of successive replacement, first of the red clade by the blue clade, and then the green clade of Caninae replaced both of them1. And they could actually estimate the strength of the competitive effect, which is shown here in white and grey.
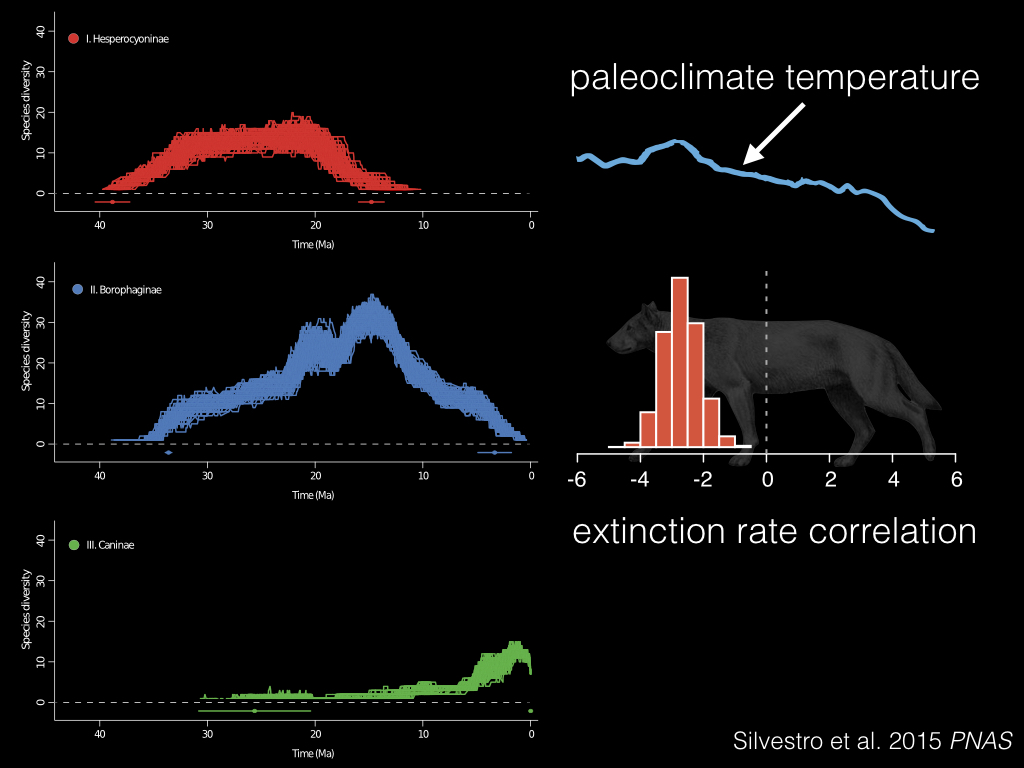
What’s nice about Daniele’s framework is that you can use this to test more than just competition. Here we’re looking at the effect of temperature on the diversity of this middle clade in blue. And what they found was a negative correlation with extinction rate, where when the temperatures went down, extinction rates went up – possibly contributing to its decline!
Rates in Cultural Evolution
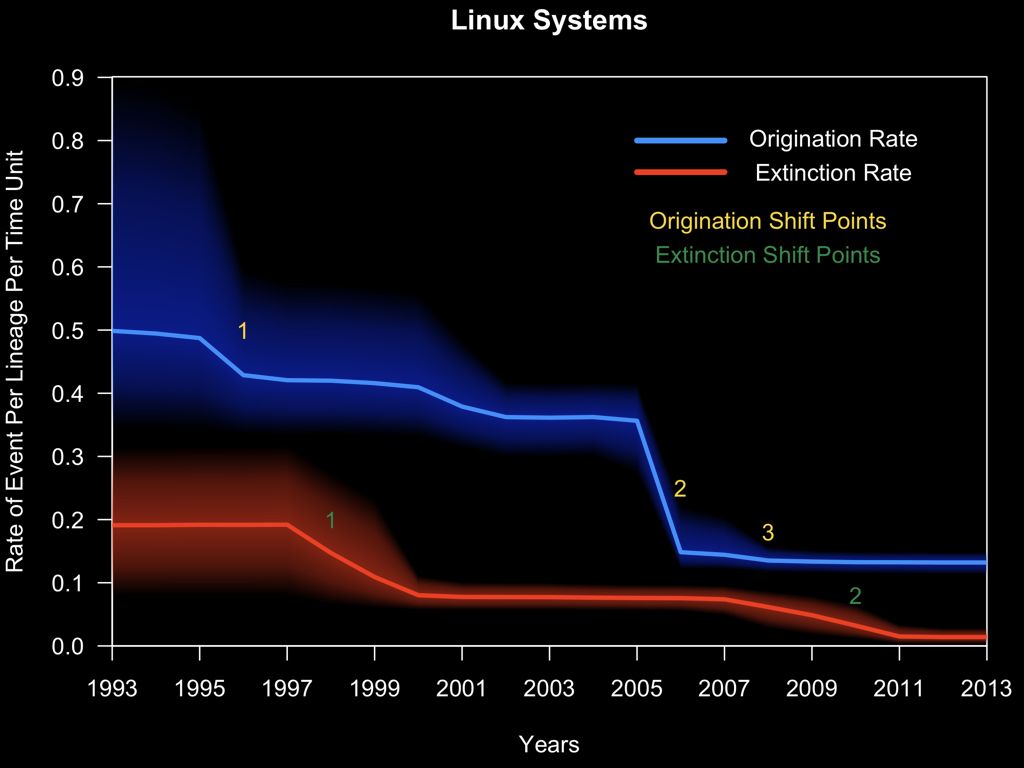
Why am I showing you all of this? Well, I believe that this way of looking at data, is sufficiently general to be applied to more than just biological systems. Here I’ve done a similar thing and analyzed the diversification dynamics of Linux distributions. And what I found was that in the mid 90s and again in the 2000s there were significant declines in the origination rate of Linux distributions.

And based on these data I could test a few hypotheses, like whether certain kinds of distributions were more successful. So I classified the Linux distributions into a couple of broad categories and found that, yes, there are some pretty interesting competitive interactions going on between these distros!
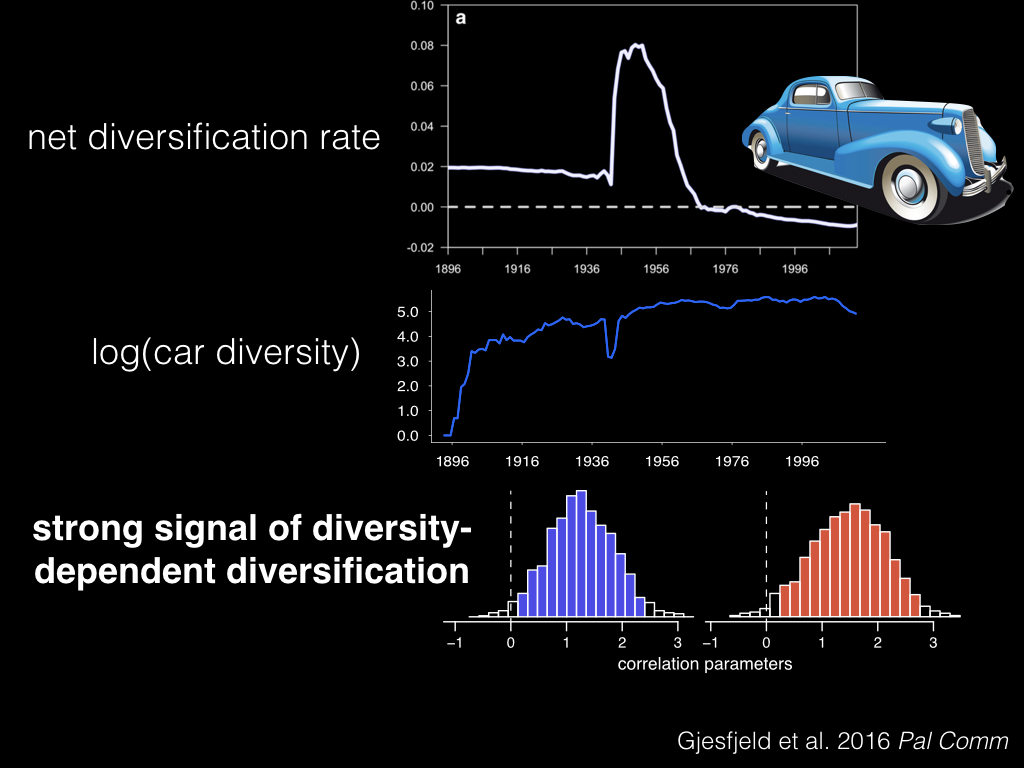
What Erik Gjesfjeld and the rest of us did for our Palgrave Communications paper last year, was to look at the diversification of American car models in the last century. And we found a huge spike in the diversification rate of car models post WW2, with a decline to a negative rate aftewards.
And again using this framework, we found a strong signal of diversity-dependent diversification, where our diversification rates were correlated with the overall diversity of car models.
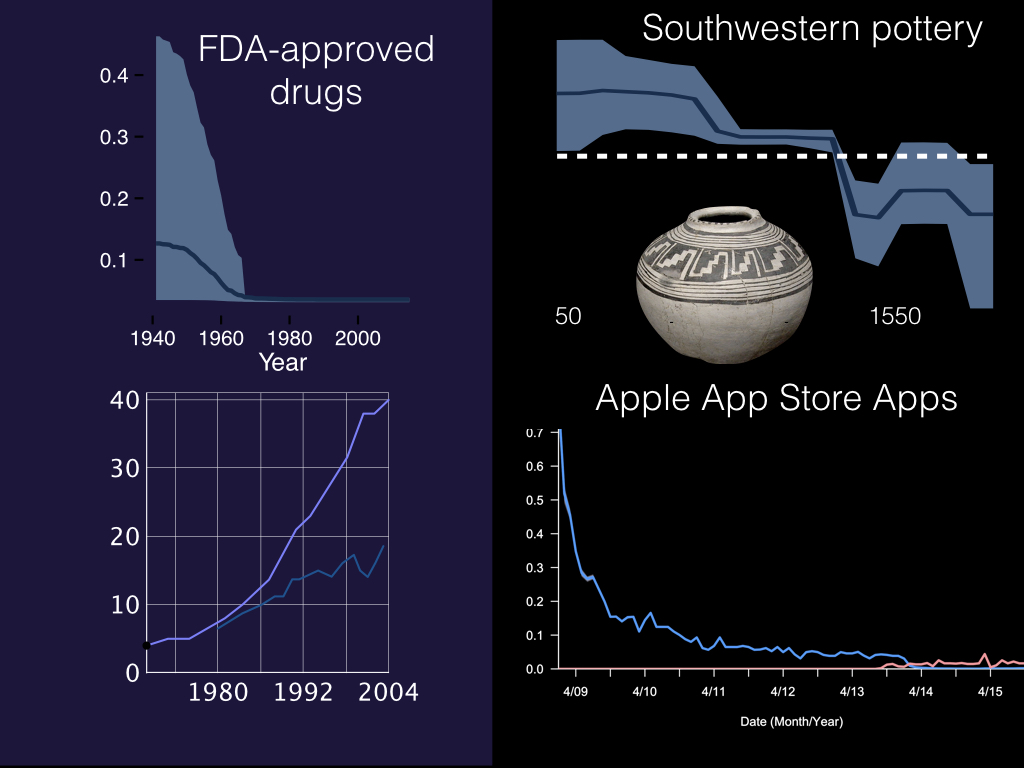
We’ve tested a number of different cultural systems now, ranging from the number of FDA-approved drugs on the left, to the diversity of pottery types in the American Southwest and the number of apps available in Apple’s App Store.
Motivating Conclusion
The point I want to make here is that looking at origination and extinction rates in this way is an extremely powerful framework for testing hypotheses about why lineages succeed and why they stick around.
What we’ve learned in the biologicial literature is that origination and extinction are definitely separate processes that must be considered in order to understand the dynamics of a system.
For example, you can do really well with high origination rates and explode onto the scene, but you won’t stick around for very long if that lineage also has high extinction rates. Furthermore, we can also test for a variety of different factors that could be influencing how those rates change through time, like various environmental variables or the effect of competition from other lineages.
When you’re looking at your own systems, there are a couple of things from biology that we’ve found to be generally protective against extinction. Having a broad distribution helps, as does having a generalist life history. Not being terribly big also helps, probably related to not being too specialized and falling into an evolutionary dead end.
One last thing to keep in mind is that all that I’ve been talking about today only really applies to background extinction. Mass extinctions throw the rulebook out the window and are extremely disruptive, black swan events that ignore what we know about extinction resistance.

Thank you all for listening. None of this work would be possible without my awesome collaborators, and I’d be happy to take any questions.
Thanks to my advisor Michael Alfaro for helping me to conceptualize this talk, as well as Daniele Silvestro and Erik Gjesfjeld for many of the figures. The House of Meatballs was an essential venue for developing our early ideas. Meng Wong patiently listened and gave constructive feedback on my slides.
-
I actually oversimplified this part of Daniele’s paper for the talk, as he actually tested many more carnivoran taxa, and found a smaller but still significant competitive effect of felids and other non-caniform taxa as well. ↩